Charts I Heart, Part II
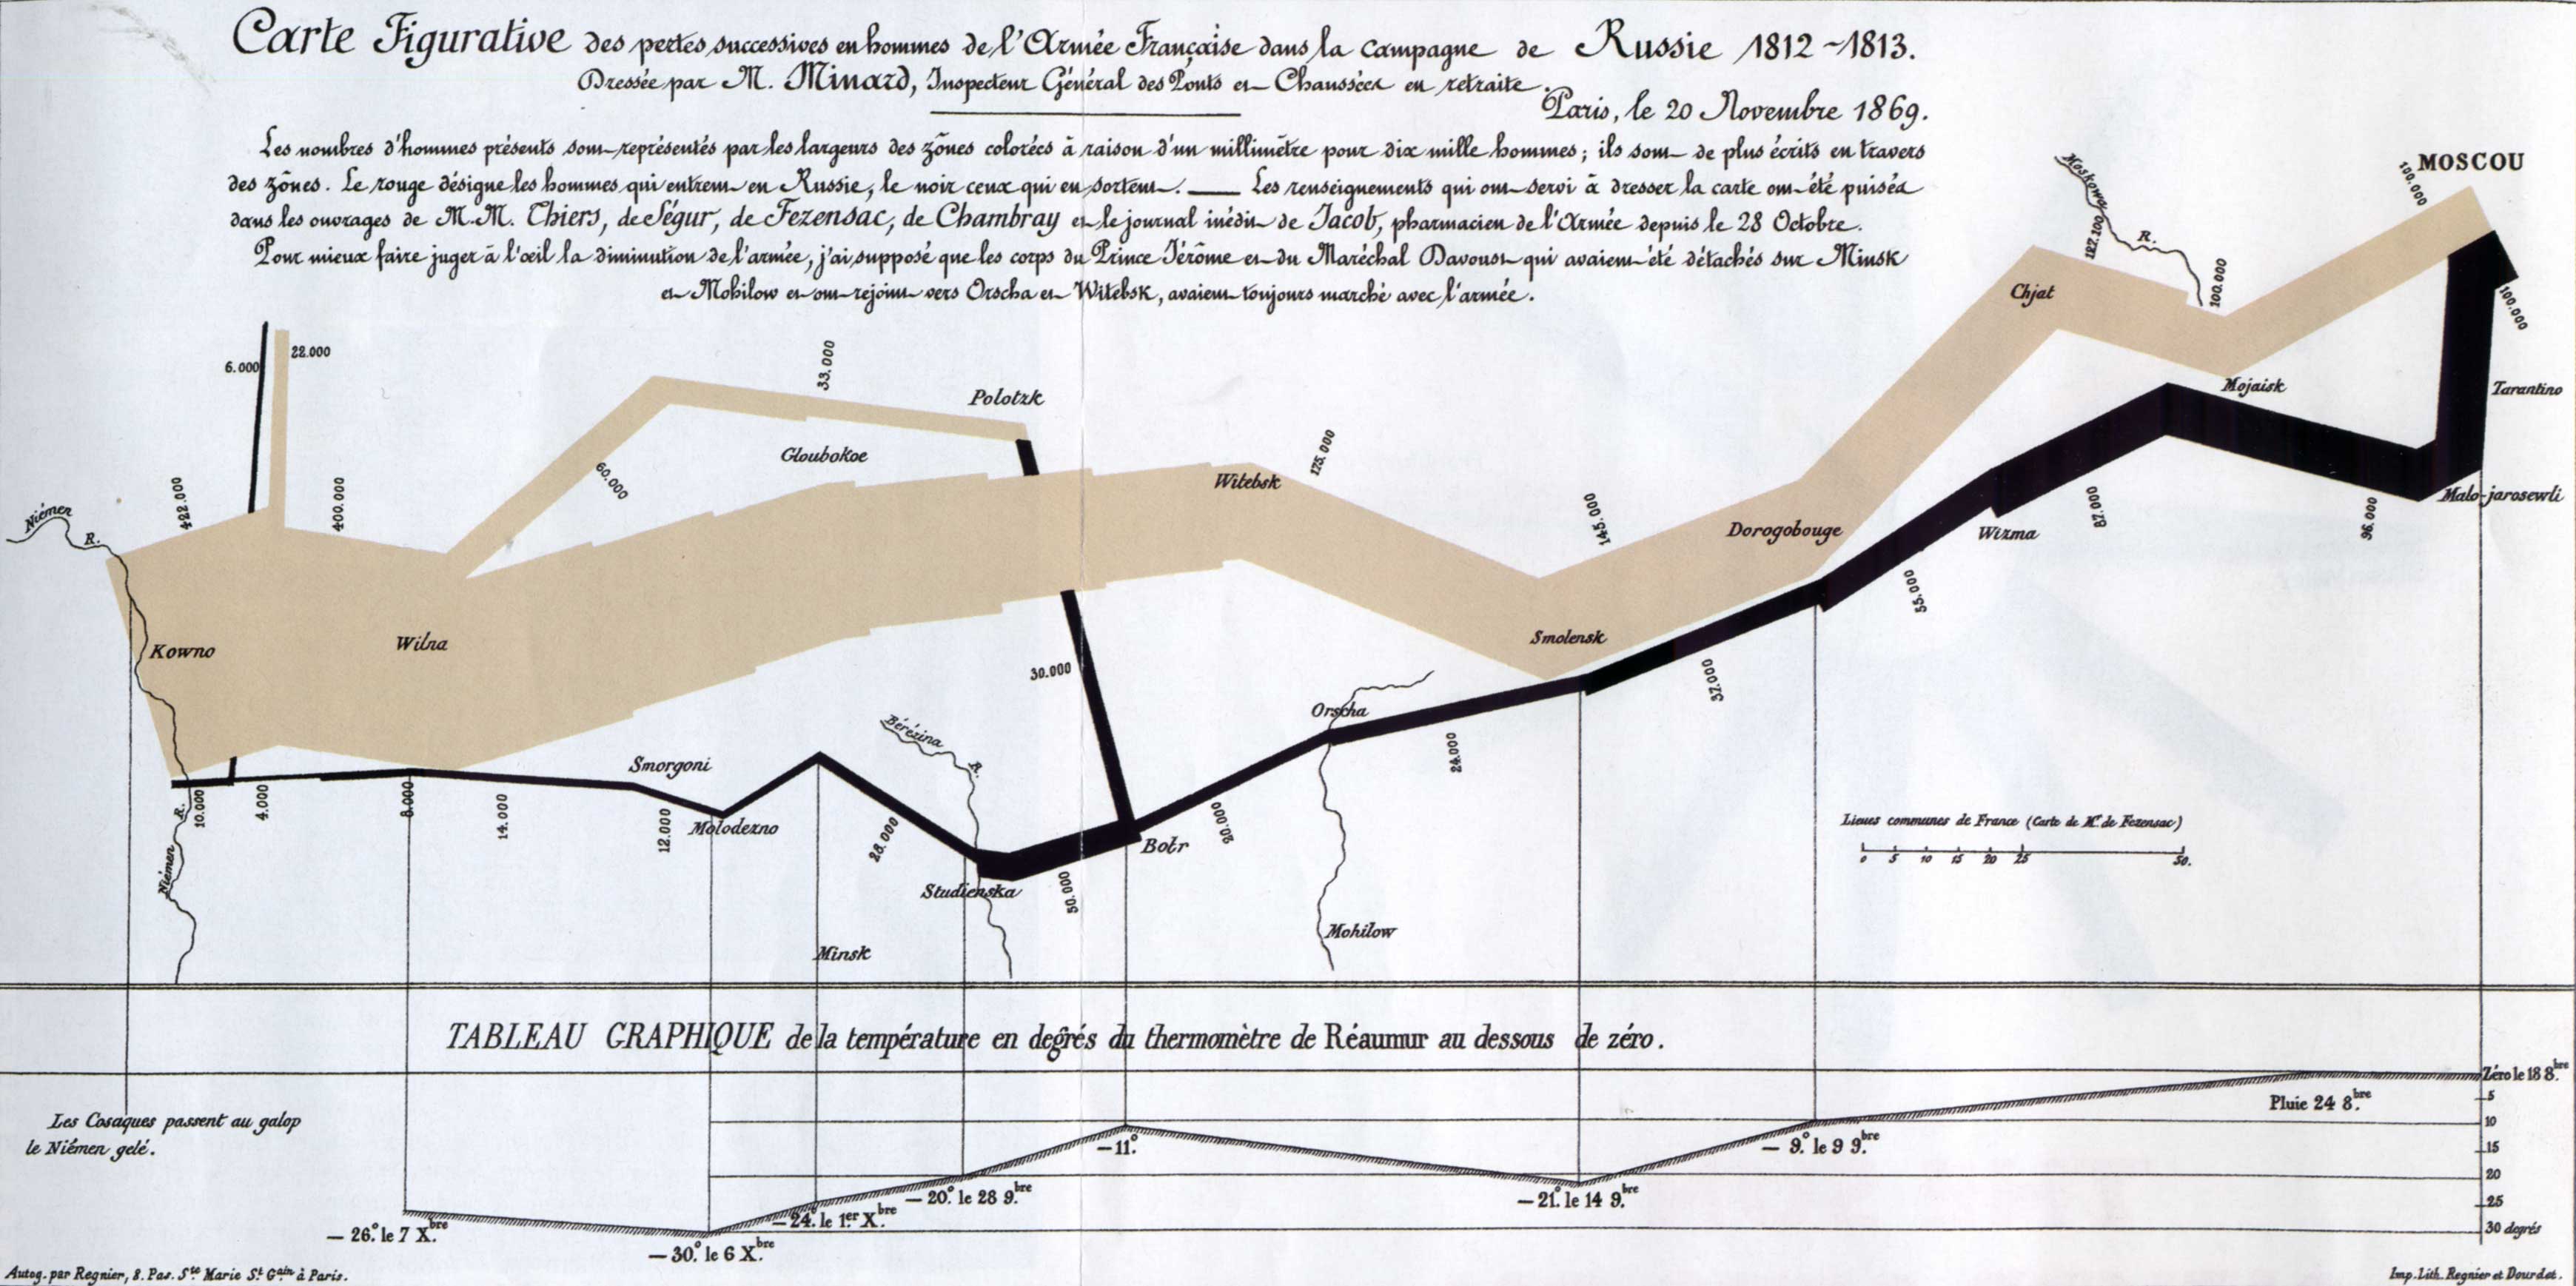
 Since I wrote about a graph of baby names yesterday, I decided I had to write about this graph, because it is amazing and awesome. In case you don't read French micro-script, it's a graph showing Napoleon's army size during his Russian Campaign, as he advances on Moscow and then retreats. The numbers on this image are tiny, but a larger version shows that Napoleon left with 422,000 troops and returned with 10,000. The bottom of the graph shows the temperature at various part of the return. If a picture's usually worth a 1000 words, this graph is more like 10,000 words, or at least a textbook chapter. For instance, you can quickly see that Napoleon had lost 275,000 troops before even reaching Moscow, and that he lost a further 140,000 on the return home. There's simply a staggering amount of information contained in this graph, which is why I find it fascinating and had to share it.
![]()
No comments:
Post a Comment